The Report Window
Home > Getting Started > Execute a Simulation and Analyzing Results > View Simulation Results
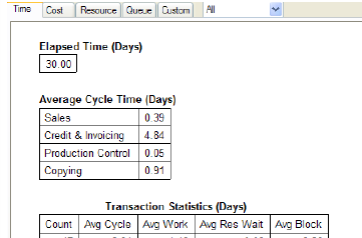
You view statistical results of the latest simulation run in the Report window. For more information about the Report window, see The Modeling and Simulation Environment.
|
The Report Window |
The default view of report elements is tables. Try changing a report element from a table to a graph:
Double-click the report element.
In the Edit Report Element dialog box, click the Format tab.
Choose Graph from the Display As drop-down list.
Click the Graph Style button, then choose a graph style.
Four of the Report tabs (Time, Cost, Resource, and Queue) contain sets of commonly used statistics captured during simulation. You can copy and paste an existing report element or create a new report element from the Report menu to appear on the blank Custom tab.
Try adding a report element (table or graph) to the Custom tab by copying and pasting an existing report element, or creating a new report element using the Report menu. The Default button appears near the Report tabs when you change any of the default report elements. Click the Default button to reset report elements on the page to default settings.
The categories of statistics in the Report window are:
|
Report Tab |
Contents and Description |
|---|---|
|
Time |
Statistics that measure time during the simulation. Shows overall transaction times, and times categorized by swimlane, process, and activity. |
|
Cost |
Statistics about costs related to transactions, activities and resources. |
|
Resources |
Statistics related to resource utilization, resource time categorizations, and activity and resource costs. |
|
Queue |
Statistics collected when transactions waited for processing at activities due to resource, inputs collection, or other constraints. |
|
Custom |
May contain newly defined statistics, or statistics copied and pasted from any of the other pages |
The statistics on each report page are further organized according to these categories:
|
Statistics Type |
Data |
|---|---|
|
Transaction |
Accumulated for each transaction that completes processing |
|
Resource |
Accumulated for each resource used in the process |
|
Activity |
Accumulated for each activity in the process |
|
Monitor |
Accumulated for each monitor defined in the process |
|
Custom |
Collected for each user-defined statistic |
iGrafx categorizes basic statistics depending on whether they apply to transactions, resources, or activities. See Process Simulation Statistics Reference.
Report Results
iGrafx gathers basic statistics about process times, costs, resources, and waiting lines or queues. You can create your own custom statistics. The basic statistics are categorized depending on whether they apply to transactions, resources, or activities (see the table below).
For more information, see Process Simulation Statistics Reference.
|
Transaction |
Resource |
Activity |
|---|---|---|
|
Completion Count |
Number of Workers (Count) |
Cycle Time (Avg, Tot) |
|
Cycle Time (Avg, Tot) |
Utilization (Util.%) |
Work Time (Avg, Tot) |
|
Work Time (Avg, Tot) |
Busy Time (Avg., Tot.) |
Wait Time (Avg, Tot) |
|
Wait Time (Avg, Tot) |
Idle Time (Avg., Tot.) |
Costs (VA, NVA, BVA) |
|
Resource Wait Time (Avg, Tot) |
Out Of Service Time (OOS) |
# Trans.Wait (Tavg, Tot, Max) |
|
Blocked Time (Avg, Tot) |
Inactive Time (Avg, Tot) |
# Trans. at Activity (Tavg, Max) |
|
Inactive Time (Avg, Tot) |
Overtime (OT) |
# Transactions |
|
Service Time (Avg, Tot) |
Costs (Tot, Stdev, OT, Busy) |
|
|
Costs (VA, NVA, Labor, Equip) |
|
|
Place the cursor over a statistic heading in the report to view ToolTips that explain statistics in more detail. ToolTips do not explain summarizations like Min, Max, Average, and Total.
Related Topics
Common Default Report Statistics
The following tables describe the most common default report statistics.
|
Basic Transaction and Activity Time Statistics |
|
|---|---|
|
Work Time |
Time accumulated doing work (Task page duration) |
|
Resource Wait Time |
Time accumulated waiting to obtain a resource (Resources page) |
|
Blocked Time |
Time accumulated waiting in collection (Inputs page) and in delay (Task page) |
|
Inactive Time |
Time accumulated waiting for a resource that is inactive or out of schedule |
|
Composite Transaction and Activity Time Statistics |
|
|---|---|
|
Cycle Time |
Blocked Time + Resource Wait Time + Inactive Time + Work Time |
|
Service Time |
Blocked Time + Resource Wait Time + Work Time |
|
Wait Time |
Blocked Time + Resource Wait Time + Inactive Time |
|
Service Wait Time |
Blocked Time + Resource Wait Time |
|
Basic Resource Time Statistics |
|
|---|---|
|
Busy Time |
Paid time the resource is acquired, such as Active and Working (Task page Duration) |
|
Idle Time |
Paid time the resource is active and in schedule, but not busy |
|
Out of Service |
Paid or unpaid time the resource is scheduled to be active and also unavailable |
|
Inactive Time |
Remaining time when the resource is not scheduled to be available or Out of Service |
Related Topics
See Also