Home > Value Stream Map Procedures and Reference > Lean Data Reference
Lean Data is entered either for the overall diagram (setting the environment for display and calculation of diagram data such as Takt time), or on individual shapes (steps) of the Value Stream Map.
Data Elements Entered on the Diagram
From the Lean menu, choose Value Stream Map Properties. These values set the environment for data available to, and calculations for, the diagram shapes and VSM Timeline. These values are Timeline-specific; each Timeline may have its own set of values. For example, Available Time, Takt Time, how to calculate Inventory Lead Time, units on the Timeline, etc. The following table gives an overview of this data, and references more detailed documentation.
|
Element |
Description |
|
Available Work Time, Takt Time, Inventory Lead Time |
See Value Stream Map Properties dialog box - Lean Timelines - Setup tab |
|
Value Stream Map Style, Show Timeline or Distance line, and labels. |
See Value Stream Map Properties dialog box - Lean Timelines - Timeline tab |
|
Show Work Balancing Graph and its options |
See Value Stream Map Properties dialog box - Lean Timelines - Graph tab |
Introduction to Data Elements Entered on Shapes
Some shape data elements are entered, some are calculated, and some entered data elements are calculated by relationship to other data elements. For example, if you enter Processing time, it is assumed to be all Value Add (VA) Time. If you also enter Non-Value Added (NVA) Time, VA Time will be calculated for you; see the table below. In addition, certain data elements, such as NVA, VA, that total greater than the Total Cycle Time, a data entry warning appears to alert you to the discrepancy. The value in parentheses shows the correct or implied value.
|
|
Lean data types use Custom Data types as shown in the following tables. The Setup Custom Data dialog box provides these data elements.
Data Elements with Entered Values
These values, sorted alphabetically, are manually entered on a shape.
|
Lean Type |
Custom Data Type |
Notes |
|---|---|---|
|
Availability% |
Percent |
The percentage of time operators are available for this step in the process. |
|
Change Over Time |
Duration |
The time taken to change from producing one type of product to another type of product. Assumed to be the average accumulated Change Over (C/O) time per shift. |
|
Defect% |
Percent |
The percentage of flawed products discarded at a step. Used to calculate Timeline data type Rolled Throughput Yield. |
|
Defective Deliveries |
Percent |
The percentage of products damaged in the process of being delivered at a step. |
|
Distance Traveled |
Distance |
The physical distance the product travels between or within a process step. Supports both imperial and metric distance units. |
|
Inventory Amount |
Number |
The number of pieces between or at a process step. Time is calculated as per VSM properties. |
|
Inventory Time |
Duration |
Combined with Inventory Amount on the Timeline if Inventory Amount is also entered. For more information about how Inventory Lead Time is calculated, see Value Stream Map Properties dialog box - Lean Timelines - Setup tab. |
|
NVA Time |
Duration |
The time in a process step that a customer is not willing to pay for. Usually defined for steps that do work, as Inventory time or Transport time typically record the time it takes to move materials. |
|
Operators |
Number |
The number of workers per shift, working in parallel at a step. Enter numbers greater than zero. An empty field calculates as 1. If a value is entered, then a visual indicator and number show on the shape. Any number larger than 1 reduces Production Time and increases the Capacity of the step, because the notion of parallel identical operators, stations, or equipment is introduced. Processing Time (Total C/T) remains unchanged, as each parallel operator/operation still takes the same amount of time on each piece of work. So changing the number of Operators will affect the Work Balancing graph (Production Time), but will not affect the Lead Time (Processing Time) on the Timeline. |
|
Processing Time |
Duration |
The time for one product to move through a process step. This is sometimes referred to as Total Cycle Time. When Processing Time is called Cycle Time, it can be confused with Production Time (the time between products leaving a process step). They evaluate to the same if you have one full-time operator, no defects, and 100% availability. |
|
Transport Time |
Duration |
Time taken to move materials between steps. |
|
Uptime% |
Percent |
The percentage of time needed equipment is available for this step in the process. |
|
Value Add Time |
Duration |
Time in a process step that a customer is willing to pay for. |
Data Elements with Calculated Values
These values can be calculated for you, or you can override the automatic calculation. Substitute the percentage value with the decimal equivalent; e.g. “100%” is “1.0” and “5%” is “0.05”.
|
Lean Type |
Custom Data Type |
Calculation |
|---|---|---|
|
Available Time |
Time (default to sec.) |
Based on Diagram settings. See Value Stream Map Properties dialog box - Lean Timelines - Setup tab |
|
Takt Time |
Time (default to sec.) |
Based on Diagram Settings. Calculated as Available Time / Customer Demand. |
|
Shifts |
Number |
Based on Diagram settings. This value can be overridden to affect capacity at a process step. |
|
Production Time |
Time (default to sec.) |
Processing Time / ((100% - Defect%) * (Operators * Availability%)) |
|
Capacity |
Number (per day) |
((Available Time - C/O) * #Shifts * Uptime%) / Production Time |
|
|
Production Time is sometimes called Cycle Time or Net Cycle Time and is defined as the rate at which a new piece is completed by a process step. |
These data types are used to calculate data that appears in the Timeline. Raw Materials, Work In Process, and Finished Goods are automatically calculated, based on Value-Add Time.
|
Lean Type |
Custom Data Type |
Calculation |
|---|---|---|
|
Process Cycle Efficiency |
Percent |
(Value Add/Total Time) * 100 |
|
Rolled Throughput Yield |
Percent |
Product of Yield at each step. iGrafx measures defects through Defect%. Yield is based on 100% - Defect%. |
|
Raw Materials |
Time |
Time before valuable work is started. |
|
Work In Process |
Time |
Time spent from first valuable step to last valuable step. Includes all time that passes from the first step with Value-Add time to the last step with Value-Add time. Time before the first WIP shape is deemed to be Raw Materials, and time after the last WIP step is deemed to be Finished Goods. |
|
Finished Goods |
Time |
Time after valuable work is completed. |
Lean Custom Data in the Built-In Template
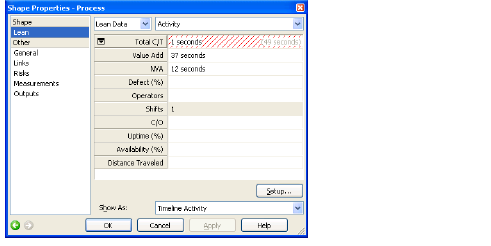
See Properties dialog box - Lean Data page.
Related Topics
