This functionality is available in iGrafx Process and above.
Home > Process Simulation Procedures > Report Elements
|
|
This functionality is available in iGrafx Process and above. |
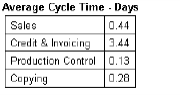
In a simulation report, data is organized in collections of related simulation statistics called report elements, which you can view as a table or graph.
|
Report element |
You can view added report elements without rerunning the simulation. However, if you change the process map or scenario, you must run the simulation again to view the new results.
|
Task |
Procedure |
|---|---|
|
|
|
|
|
|
|
|
|
|
|
In the Report window, double-click a report element and click the Statistics tab. For a list of statistics, their names, and abbreviations, see Process Simulation Statistics Reference. |
|
|
In the Report window, double-click a report element and click the Structure tab to select labels for the statistics that appear in the selected report element. |
|
|
In the Report window, double-click a report element and click the Filters tab. For example, to view selected resource statistics by resource and by swimlane, filter the data by swimlane to define multiple report elements that show resource statistics by resource per a single swimlane. |
|
|
Format statistics |
In the Report window, double-click a report element and click the Format tab to sort the statistics in the selected report element, and specify time units, number formats, and other display options. |
Related Topics