An example Cause and Effect diagram
Home > Cause and Effect Diagram Procedures > Cause and Effect Example
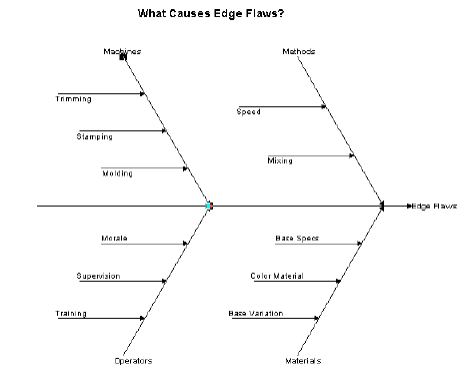
In the following example using a Transactional Cause and Effect diagram type, the central arrow–Edge Flaws–is the effect being analyzed. Each of the arrows leading into the central arrow represents a cause of edge flaws in the product. These causes are further broken down into sub-causes, like Stamping, Molding, and Trimming.
|
An example Cause and Effect diagram |
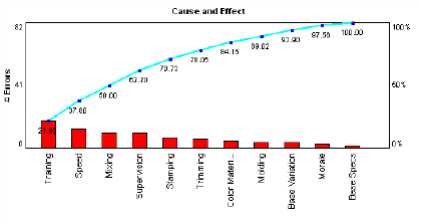
For each cause in a Cause and Effect diagram, you can assign the number of errors introduced by the cause into the process. The cumulation of the number of errors from all of the causes in the diagram represent the total number of errors introduced into the process. These errors may be represented in an accompanying Pareto chart such as the following:
|
An example Pareto chart |
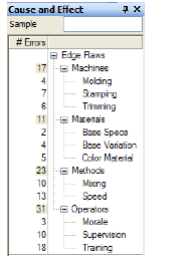
You can roll up errors to show a summary of sub-cause errors for each branch in the Cause and Effect window. (On the Cause and Effect menu, choose Rollup Errors.)
|
Rolled-up errors in the Cause and Effect window |
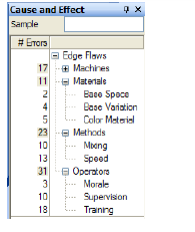
If you collapse a branch (hide sub-causes) in the Cause and Effect window, the Pareto chart also hides the sub-causes.
|
Collapsed branch (Machines) in the Cause and Effect window |
Related Topics